


All blog posts
Filter

Grow Your Business with Our Resource Center
Jan 25, 2024
AppLovin Q4 ’23 – Q1 ’24 Updates! #SHIPPED
Jan 18, 2024
#SHIPPED: Product Updates Driving Mobile App Growth
Jan 18, 2024

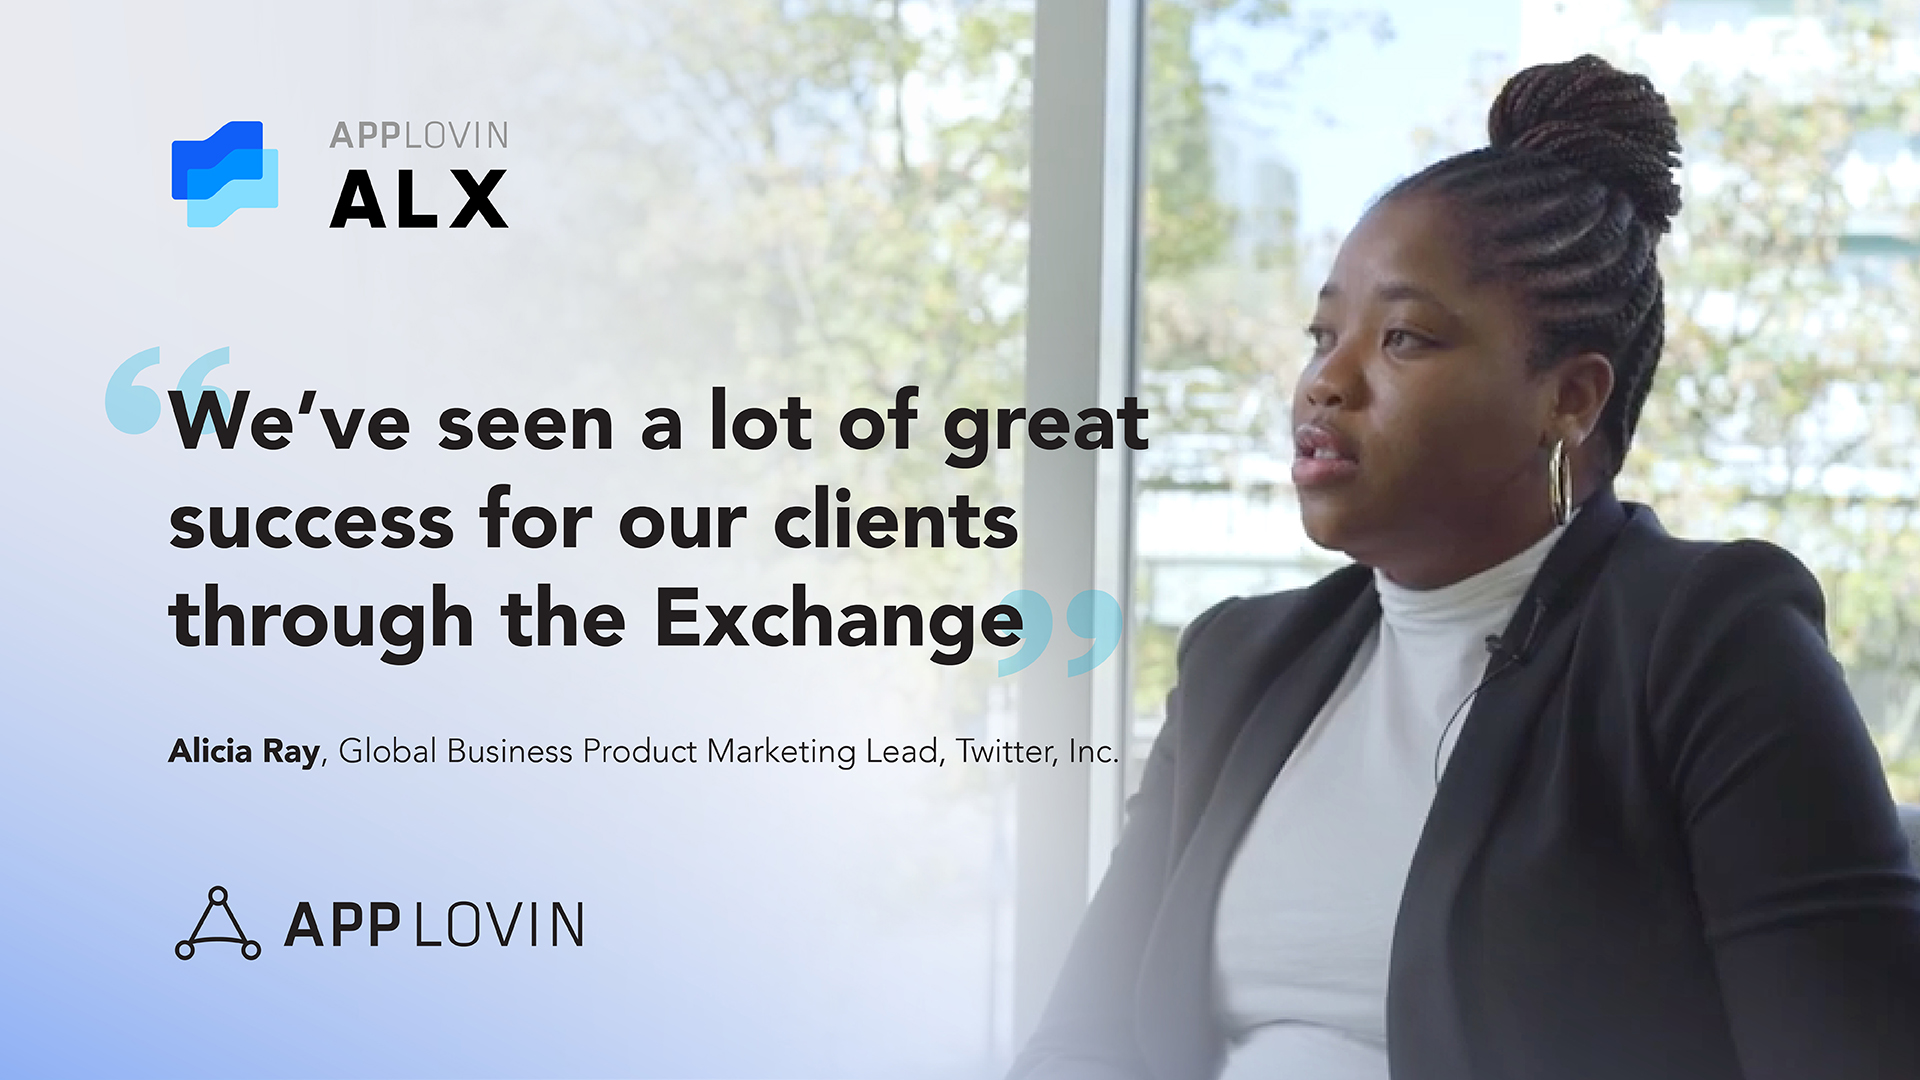


Reach Diverse, Engaged Audiences with In-Game Ads
Oct 13, 2022


AdWeek Nominated AppLovin for an Award, Here’s Why
Aug 18, 2022
AppLovin’s Partner Directory Now Available
Jul 8, 2022